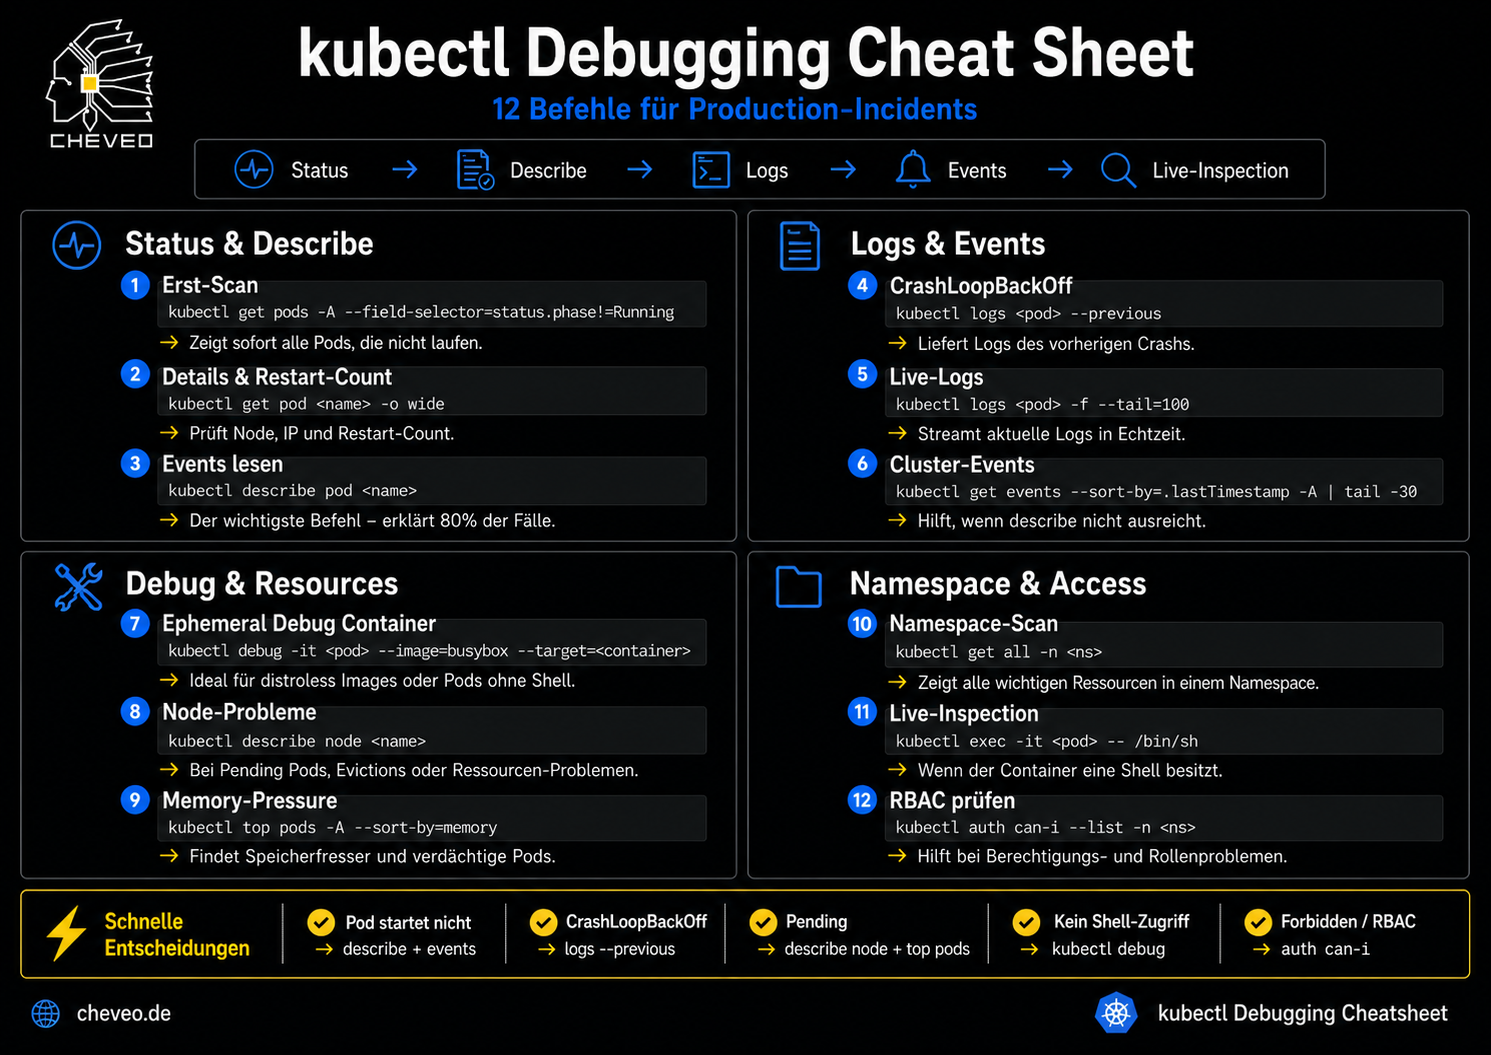
Cheveo Cheatsheet

kubectl Debugging Cheatsheet

12 commands for production incidents - structured by domain, with copy buttons and a decision tree. Printable, free, no signup.

PNG Read the article →

The workflow

1 Status
2 Describe
3 Logs
4 Events
5 Live Inspection

Status & Describe

1

First scan

kubectl get pods -A --field-selector=status.phase!=Running

→ Instantly shows every pod that is not running.

2

Details & restart count

kubectl get pod <name> -o wide

→ Shows node, IP and restart count.

3

Read events

kubectl describe pod <name>

→ The most important command - solves 80 % of cases.

Logs & Events

4

CrashLoopBackOff

kubectl logs <pod> --previous

→ Returns the logs of the previous crash.

5

Live logs

kubectl logs <pod> -f --tail=100

→ Streams the latest logs in real time.

6

Cluster events

kubectl get events --sort-by=.lastTimestamp -A | tail -30

→ Helps when describe falls short.

Debug & Resources

7

Ephemeral debug container

kubectl debug -it <pod> --image=busybox --target=<container>

→ Ideal for distroless images or pods without a shell.

8

Node problems

kubectl describe node <name>

→ For pending pods, evictions or resource issues.

9

Memory pressure

kubectl top pods -A --sort-by=memory

→ Finds memory hogs and suspicious pods.

Namespace & Access

10

Namespace scan

kubectl get all -n <ns>

→ Shows every key resource in a namespace.

11

Live inspection

kubectl exec -it <pod> -- /bin/sh

→ When the container has a shell.

12

Check RBAC

kubectl auth can-i --list -n <ns>

→ Helps with permissions and role issues.

Quick decisions

Pod won't start
→ describe + events
CrashLoopBackOff
→ logs --previous
Pending
→ describe node + top pods
No shell access
→ kubectl debug
Forbidden / RBAC
→ auth can-i
1-Day Intensive Workshop

Kubernetes Debugging - systematic, not guesswork

Replay real production incidents, internalise kubectl workflows, find root causes in minutes.

View workshop details