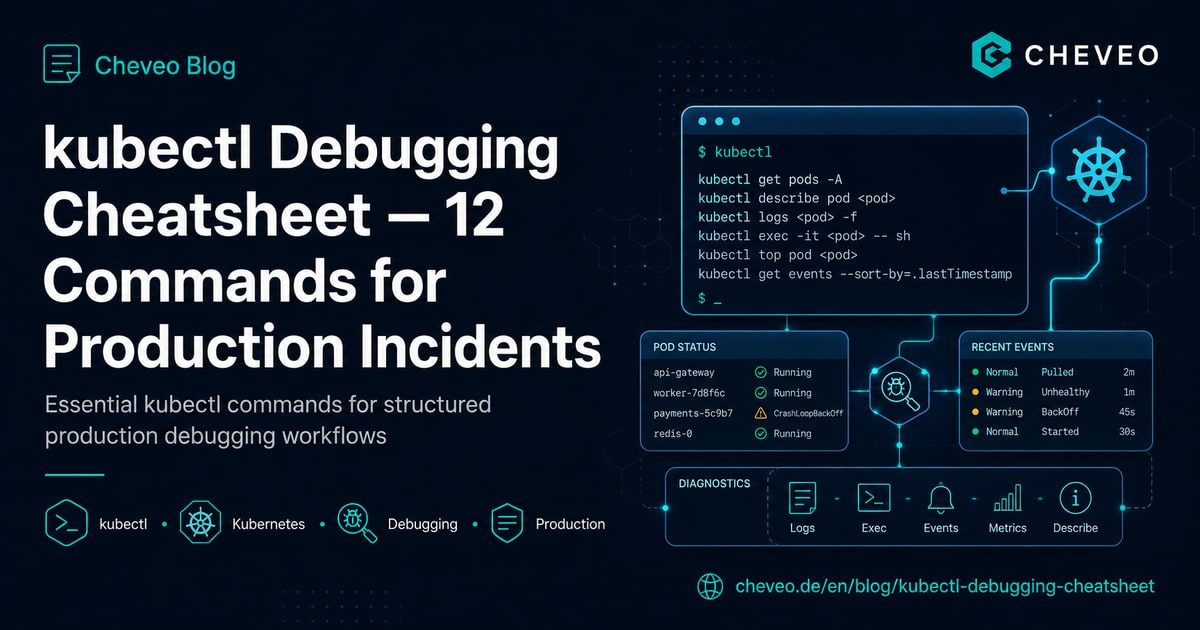
kubectl Debugging Cheatsheet: 12 Commands for Production Incidents
Structured debugging workflow for Kubernetes in production: 12 kubectl commands in the right order - from pod status to ephemeral debug containers.
TL;DR - In production incidents, command order matters more than knowledge. This cheatsheet is the order our engineers use with clients every day: first
get, thendescribe, thenlogs, thenevents, thendebug. Master these 12 commands in the right order and you’ll solve 90% of all pod problems in under 5 minutes.
🔖 Just the commands? Here’s the interactive cheatsheet - one-click copy, Markdown export, print view. Bookmark recommended.
Order is the trick
Most engineers jump straight to kubectl logs and then sit clueless when the pod hasn’t even started. Production debugging has a fixed pyramid:
- Status - what does the cluster say about the pod?
- Description - what do events and conditions say?
- Logs - what did the container itself say?
- Cluster events - what did the scheduler / kubelet say?
- Live inspection - what do I see when I go in?
1. Status - quick scan
kubectl get pods -A --field-selector=status.phase!=RunningInstantly shows every pod that isn’t running, cluster-wide. First question in every incident.
kubectl get pod <name> -o wideShows node, IP, restart count. High restart counts = container crashes repeatedly = OOM or liveness probe failure.
2. Describe - the most important command
kubectl describe pod <name>Scroll directly to Events: at the bottom. It literally tells you why the pod is in the state it’s in:
Events:
  Type     Reason          Age   From               Message
  ----     ------          ----  ----               -------
  Warning  FailedScheduling 2m   default-scheduler  0/3 nodes are available: 3 Insufficient memory
That’s the answer. No log reading needed.
3. Logs - if the container actually started
kubectl logs <pod> -c <container> --tail=100
kubectl logs <pod> --previous          # previous crash
kubectl logs <pod> -f                  # stream
The --previous switch is the trick. If the pod is in CrashLoopBackOff, “current” logs are empty - the container hasn’t started yet. You need the logs of the previous crash.
4. Cluster events - the underrated treasure
kubectl get events --sort-by=.lastTimestamp -A | tail -30Shows what happened in the cluster, time-sorted - scheduler decisions, image pulls, volume mounts. When describe pod doesn’t reveal anything, this almost always does.
Kubernetes Debugging - systematic, not guesswork
Replay real production incidents, internalise kubectl workflows, find root causes in minutes.
View workshop details5. Ephemeral debug container - the game-changer
Stable since Kubernetes 1.25. Works even with distroless images that have no shell:
kubectl debug -it <pod> --image=busybox --target=<container>You land in a new container that shares the process namespace and network namespace with the original. You see its processes with ps, test its network with nc/curl, and access /proc/1/root to see its filesystem.
6. Find node problems
kubectl describe node <name> | grep -A 10 Conditions
kubectl top nodes
kubectl top pods -A --sort-by=memory
When pods are pending or being evicted, it’s almost always the node - memory pressure, disk pressure or NotReady. kubectl top shows you who’s the culprit.
7. Network issues
kubectl run debug --rm -it --image=nicolaka/netshoot -- /bin/bashInside the netshoot container you have dig, nslookup, tcpdump, curl, nmap. From within the pod network you can test DNS, service resolution and NetworkPolicies.
The 12 most important commands at a glance
| # | Command | When |
|---|---|---|
| 1 | kubectl get pods -A --field-selector=status.phase!=Running | First scan |
| 2 | kubectl get pod <name> -o wide | Restart count, node |
| 3 | kubectl describe pod <name> | Read events - 80% of cases |
| 4 | kubectl logs <pod> --previous | On CrashLoopBackOff |
| 5 | kubectl logs <pod> -f --tail=100 | Live logs |
| 6 | kubectl get events --sort-by=.lastTimestamp | When describe doesn’t help |
| 7 | kubectl debug -it <pod> --image=busybox --target=<c> | Distroless / no shell |
| 8 | kubectl describe node <name> | On Pending pods |
| 9 | kubectl top pods -A --sort-by=memory | Memory-pressure search |
| 10 | kubectl get all -n <ns> | Full namespace scan |
| 11 | kubectl exec -it <pod> -- /bin/sh | Live inspection when shell exists |
| 12 | kubectl auth can-i --list -n <ns> | RBAC problems |
Bookmark for the next incident
These 12 commands also live on their own interactive cheatsheet page - one-click copy buttons, Markdown export for Notion/Obsidian, and a print-friendly view. Bookmark it; you’ll thank yourself at the next 3am incident.
What’s next
In our 1-day intensive Kubernetes Debugging Workshop we replay 8 real production incidents - CrashLoopBackOff, OOMKilled, ImagePullBackOff, NetworkPolicy block, Pending pods, evicted pods, DNS fail, liveness-probe death spiral - and drill the workflows until they stick.
If you want to start debugging on your own first: subscribe to our RSS feed for updates - a downloadable PDF cheatsheet with all 12 commands and a decision tree is coming soon.
More from the debugging series: Fix CrashLoopBackOff systematically, OOMKilled: 6 causes and Pod Pending: 23 causes with decision tree.
Kubernetes Debugging - systematic, not guesswork
Replay real production incidents, internalise kubectl workflows, find root causes in minutes.
View workshop detailsKeep reading
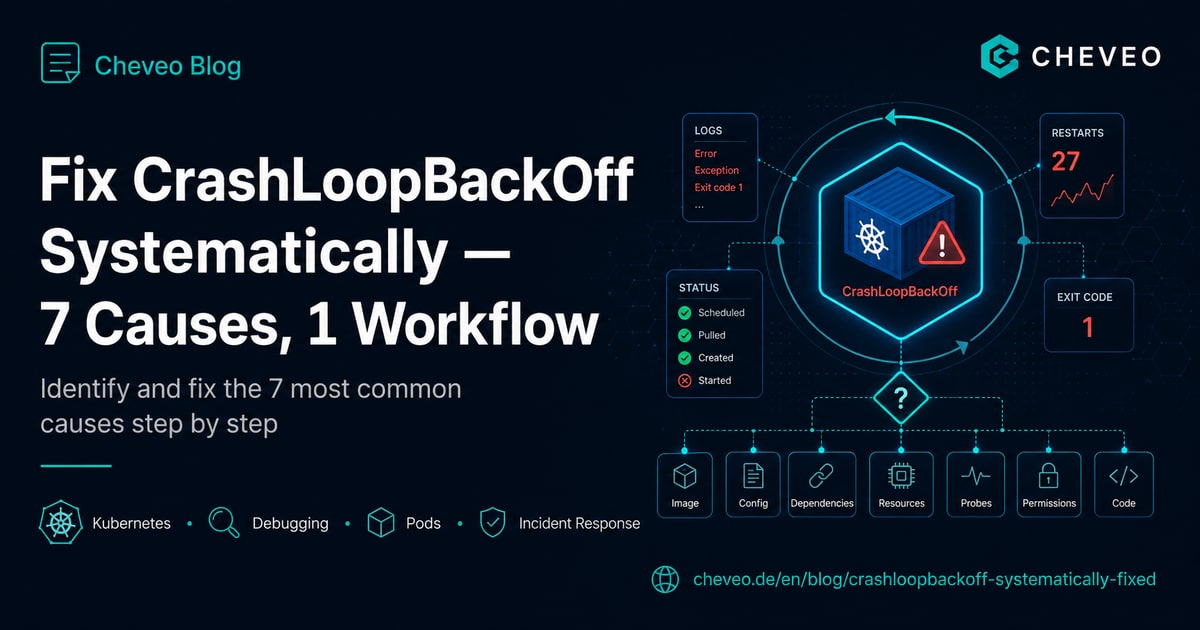
Fix CrashLoopBackOff Systematically: 7 Causes, 1 Workflow
The 7 most common causes of CrashLoopBackOff in Kubernetes - with kubectl commands, real outputs and a decision tree that finds each one in under 5 minutes.
9 min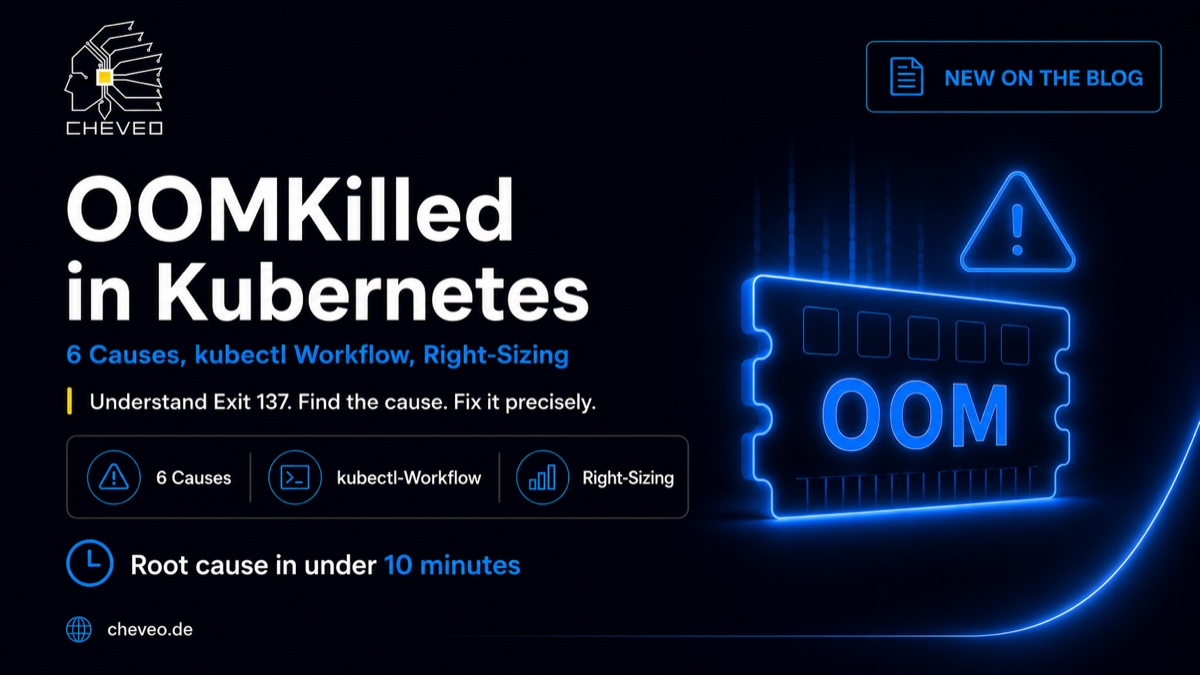
OOMKilled in Kubernetes: 6 Causes, kubectl Workflow, Right-Sizing
Pod dying with exit 137? Six causes of OOMKilled in Kubernetes, with kubectl commands, JVM gotchas, and a decision tree for right-sizing in under 10 minutes.
10 min
Pod Pending in Kubernetes: 23 Causes, Decision Tree, Fix Workflow
Pod stuck in Pending? The 23 most common causes across 5 categories, with kubectl commands, a decision tree and a workflow to diagnose in under 5 minutes.
10 minNeed a second opinion on your cluster?
Book a free 30-minute Kubernetes health check. We review your setup and give concrete recommendations, no sales pitch.
Book a slot