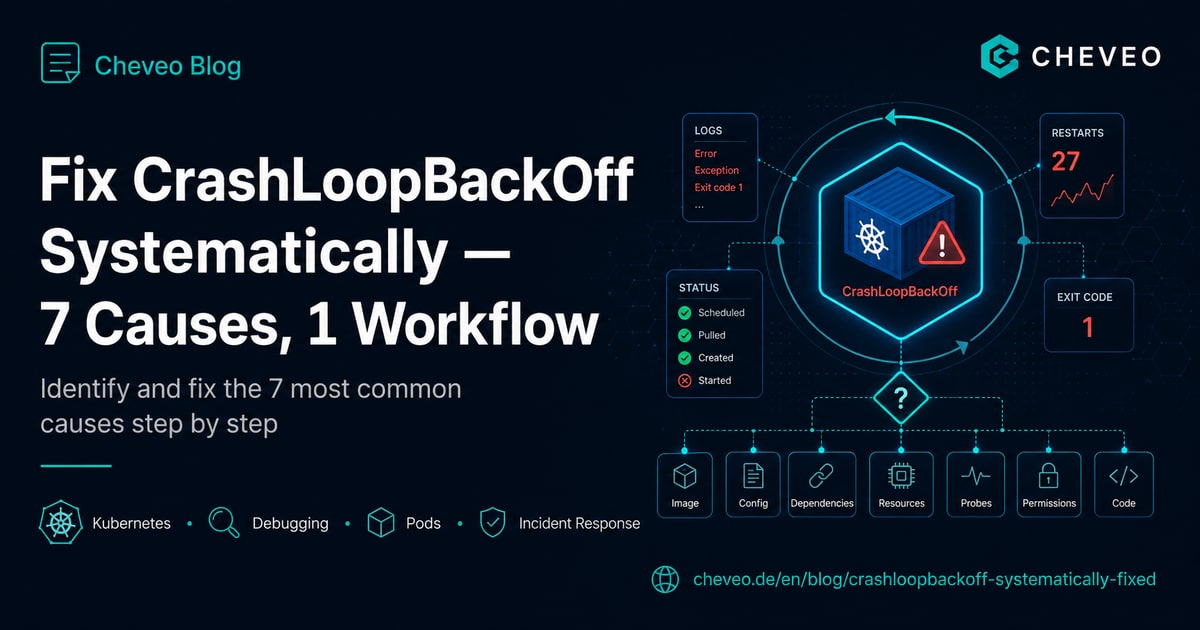
Fix CrashLoopBackOff Systematically: 7 Causes, 1 Workflow
The 7 most common causes of CrashLoopBackOff in Kubernetes - with kubectl commands, real outputs and a decision tree that finds each one in under 5 minutes.
TL;DR - CrashLoopBackOff isn’t a bug, it’s a state: the container started, crashed and is waiting for the next restart attempt. The cause is never in Kubernetes - always in the container, the manifest, or the environment. This workflow finds 90% of root causes in under 5 minutes: read the exit code, look at previous logs, check events, then test the most common of the 7 causes.
What CrashLoopBackOff really means
The term confuses more engineers than necessary. CrashLoopBackOff means:
- Kubernetes started the container
- The container terminated with a non-zero exit code
- Kubelet tried to restart it
- Crash again
- Kubelet now waits with exponential backoff until the next attempt (10s, 20s, 40s, 80s, … up to 5 minutes)
So the container isn’t running. The current attempt’s logs are empty because no restart has happened yet. You need the logs from the previous crash - this is the most important insight for everything that follows.
The 3-step workflow
Whatever the cause, these three commands always run first.
Step 1: Read the exit code
kubectl describe pod <name>Scroll to the Last State section:
Last State:     Terminated
  Reason:       Error
  Exit Code:    137
  Started:      Mon, 04 May 2026 14:20:15 +0200
  Finished:     Mon, 04 May 2026 14:20:18 +0200
The exit code is the most important piece of information:
| Exit code | Meaning |
|---|---|
| 0 | Clean exit (shouldn’t end up in CrashLoop, check restartPolicy) |
| 1 | Generic application error - read the logs |
| 2 | Misuse of shell builtins - usually a typo in the command |
| 126 | Command not executable - permission issue |
| 127 | Command not found - wrong path or missing binary |
| 137 | SIGKILL - usually OOMKilled (check the Reason) |
| 139 | SIGSEGV - segmentation fault, native code crashed |
| 143 | SIGTERM - cleanly terminated from outside, check liveness probe |
Step 2: Read previous logs
kubectl logs <pod> --previousThe --previous switch isn’t optional. Without it you see the logs of the current (not yet started) container - i.e. nothing. With it you see the logs of the last crash.
Step 3: Check system events
kubectl get events --sort-by=.lastTimestamp -n <namespace> | tail -20System events show things the container itself can’t log: OOMKilled by memory limit, FailedMount on volumes, BackOff counts.
The 7 most common causes
1. Application error (exit code 1)
By far the most common cause. The code throws an exception at startup. Reasons:
- Missing or wrong environment variable
- Database not reachable (typical race-condition symptom)
- Migration script fails
- Config file doesn’t exist or has the wrong format
Fix workflow: kubectl logs <pod> --previous, read the exception, fix it. For DB race conditions: an initContainer with wait-for-db in front of the app.
2. OOMKilled (exit code 137, Reason: OOMKilled)
Container exceeded its memory limit. Kernel killed it with SIGKILL.
kubectl describe pod <name> | grep -A 2 "Last State"
# Reason: OOMKilled
# Exit Code: 137
Fix: Raise the memory limit or find the memory leak in the code. Doubling the limit is symptomatic cosmetics - real leaks just crash the pod again later. kubectl top pod shows real-time consumption. For the full diagnosis including JVM/Node/Go gotchas, see the OOMKilled cheatsheet and the OOMKilled article.
resources:
  requests:
    memory: "256Mi"
  limits:
    memory: "512Mi"  # based on real usage, not gut feeling
3. Liveness probe fails (exit code 143, often with empty logs)
The liveness probe fails, kubelet terminates the container with SIGTERM. If the probe fails on the very first run, you usually see no logs at all.
Classic fail: initialDelaySeconds is too low. A Spring Boot app needs 30-60s to start, the probe fires after 10s and kills the container.
livenessProbe:
  httpGet:
    path: /healthz
    port: 8080
  initialDelaySeconds: 60   # not 10
  periodSeconds: 10
  failureThreshold: 3
Diagnosis:
kubectl describe pod <name> | grep -A 5 "Liveness"
kubectl get events | grep -i "liveness"Kubernetes Debugging - systematic, not guesswork
Replay real production incidents, internalise kubectl workflows, find root causes in minutes.
View workshop details4. Command not found (exit code 127)
The container image doesn’t have the command specified in the manifest. Or the path is wrong:
command: ["/usr/local/bin/myapp"] # does this actually exist?Quick test:
kubectl debug -it <pod> --image=busybox --target=<container>
# in the debug container:
ls /proc/1/root/usr/local/bin/
The ephemeral debug container shares the filesystem namespace, so you can see exactly what paths the original container had.
5. ConfigMap or Secret missing (exit code 1, often “no such file”)
The pod manifest mounts a ConfigMap that doesn’t exist. The container starts, can’t find the file, crashes.
kubectl get configmap -n <namespace>
kubectl get secret -n <namespace>
Common cause: namespace confusion. The pod is in prod, the ConfigMap is in default.
6. Wrong volume permissions (exit code 1, “permission denied”)
A mounted PV has UID/GID that the container user can’t read. Frequently happens when migrating from Docker Compose to Kubernetes.
Fix: set securityContext.fsGroup so kubelet adjusts permissions on mount:
spec:
  securityContext:
    fsGroup: 1000
  containers:
    - name: app
      image: ...
7. Race condition with the database (exit code 1, “connection refused”)
The app starts before the database, can’t connect, crashes. The restart might catch the DB - or not.
Fix: an initContainer with a wait script:
initContainers:
  - name: wait-for-db
    image: busybox:1.36
    command: ['sh', '-c', 'until nc -zv postgres 5432; do echo waiting for db; sleep 2; done']
Or better: application-level retry with exponential backoff in the code itself. initContainer is the bandage, not the cure.
Decision tree
Exit code 137 + Reason OOMKilled?  ->  Cause 2 (memory)
                                  v no
Logs --previous completely empty?  ->  Cause 3 (liveness probe)
                                  v no
Logs say "no such file"?           ->  Cause 5 (ConfigMap/Secret)
                                  v no
Logs say "permission denied"?      ->  Cause 6 (volume permissions)
                                  v no
Logs say "command not found"?      ->  Cause 4 (command/path)
                                  v no
Logs say "connection refused"?     ->  Cause 7 (race condition)
                                  v no
                                       Cause 1 (application error)
                                       -> Read logs carefully, check stack trace
What the workshops cover that this article doesn’t
This workflow handles the most common cases. What isn’t in the 7 causes:
- JVM container with hidden OOM: the Java heap explodes but the kernel doesn’t see it as OOM. You only see exit code 1 with
Killed. - Network policy blocking init egress: the app wants to fetch configs from Vault at startup, NetworkPolicy only allows inbound, app crashes without a log.
- Cluster autoscaler killing the node during pod start: pod gets evicted before liveness probe runs, restart on a new node.
These patterns need more than command order - they need system understanding. That’s the difference between “guess and try” and “find the root cause in 3 minutes”.
What’s next
In our Kubernetes Debugging Workshop we replay 8 real production incidents - including the three edge cases above - and drill the workflow until it sticks. 1 day, 8 hours, after which you solve CrashLoopBackOff systematically instead of by guessing.
Before you book: also have a look at our kubectl Debugging Cheatsheet for the 12 most important commands as a complete workflow. Also in the debugging series: OOMKilled in Kubernetes for exit-137 cases and Pod Pending: 23 causes for stuck pods.
Kubernetes Debugging - systematic, not guesswork
Replay real production incidents, internalise kubectl workflows, find root causes in minutes.
View workshop detailsKeep reading
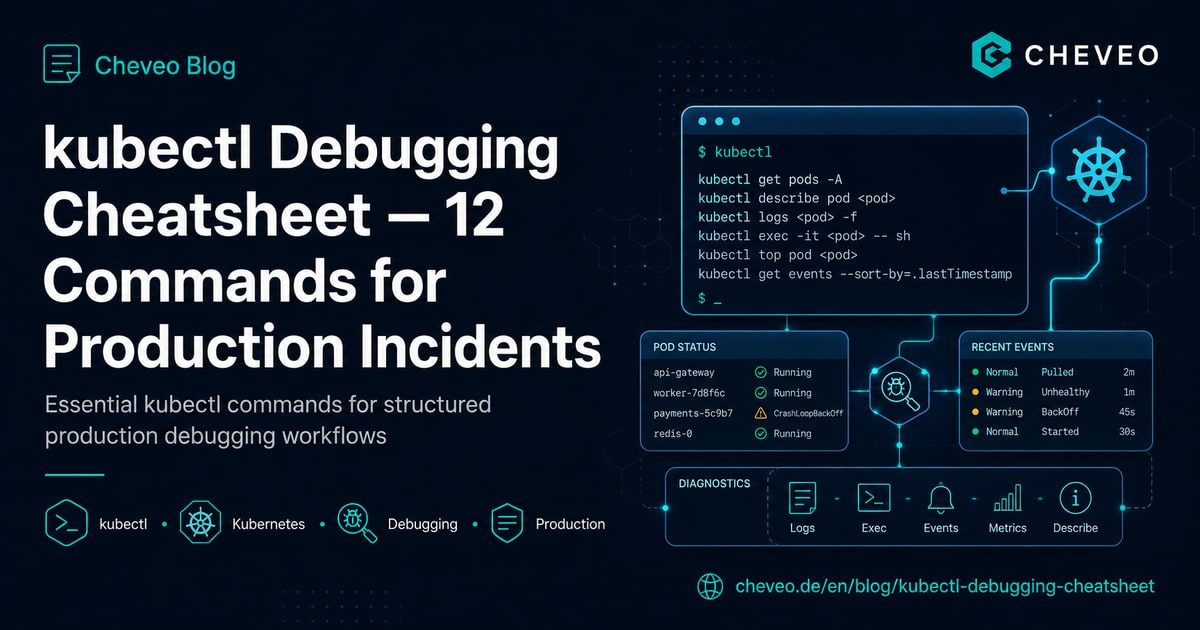
kubectl Debugging Cheatsheet: 12 Commands for Production Incidents
Structured debugging workflow for Kubernetes in production: 12 kubectl commands in the right order - from pod status to ephemeral debug containers.
8 min kubectl Debugging Cheatsheet: 12 Commands for Production Incidents
Structured debugging workflow for Kubernetes in production: 12 kubectl commands in the right order - from pod status to ephemeral debug containers.
8 min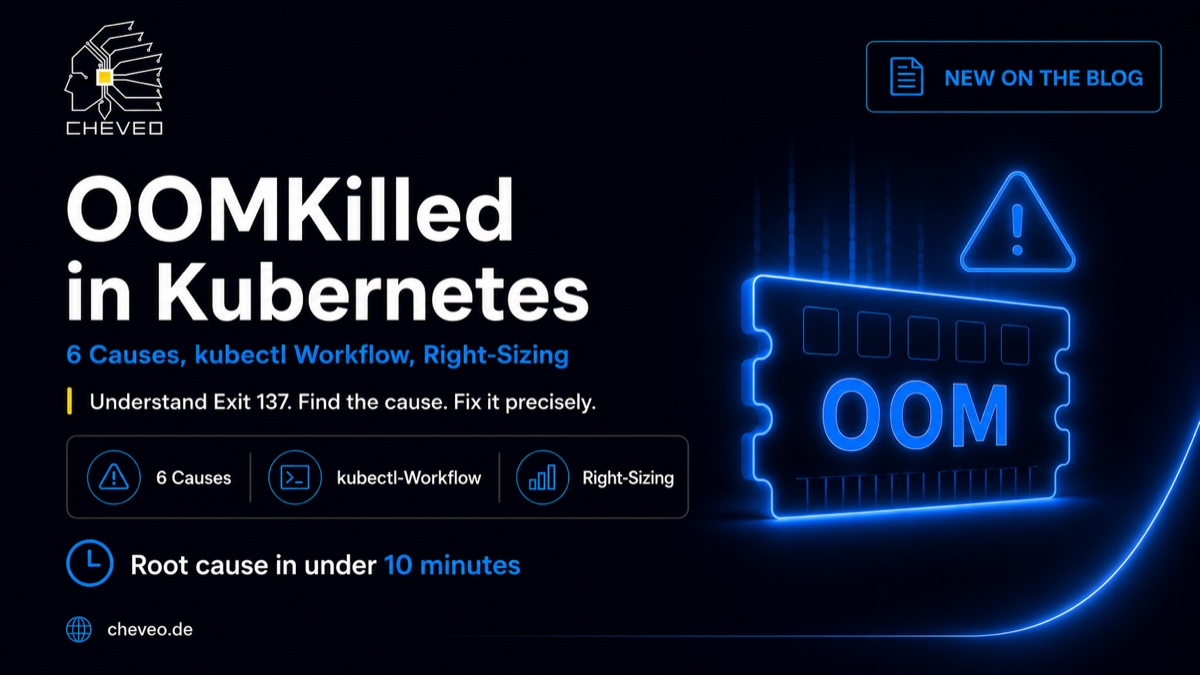
OOMKilled in Kubernetes: 6 Causes, kubectl Workflow, Right-Sizing
Pod dying with exit 137? Six causes of OOMKilled in Kubernetes, with kubectl commands, JVM gotchas, and a decision tree for right-sizing in under 10 minutes.
10 minNeed a second opinion on your cluster?
Book a free 30-minute Kubernetes health check. We review your setup and give concrete recommendations, no sales pitch.
Book a slot